Understanding Outliers
Outlier identification in continuous data streams is a critical task across various fields such as finance, network security, and environmental monitoring. Outliers can indicate unusual and potentially significant events, but they can also disrupt data analysis and model performance. This article delves into the techniques of outlier detection using Z-Score and Modified Z-Score methods within a moving window framework, providing comprehensive coding examples to illustrate these concepts.
Outliers are data points that deviate significantly from the majority of observations in a dataset. Identifying these anomalies is crucial for ensuring data quality and reliability. Outliers can result from measurement errors, data entry mistakes, or rare but significant events. Effectively detecting and managing these anomalies allows for more accurate analysis and modeling.
Z-Score Method
The Z-Score method is a widely used statistical technique for detecting outliers. It measures how many standard deviations a data point is from the mean. The formula for calculating the Z-Score of a data point xix_i is:
![]()
where μ\mu is the mean of the dataset and σ\sigma is the standard deviation. Data points with a Z-Score greater than a specified threshold (e.g., 3 or -3) are considered outliers.
Modified Z-Score Method
The Modified Z-Score is an alternative that is more robust to the presence of outliers. Instead of using the mean and standard deviation, it employs the median and the Median Absolute Deviation (MAD). The formula for the Modified Z-Score is:
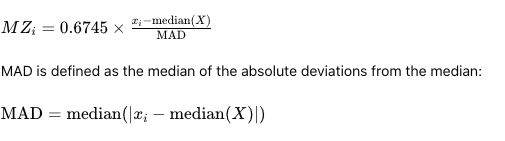
Data points with a Modified Z-Score greater than 3.5 or less than -3.5 are typically flagged as outliers.
Moving Window Technique
In continuous data streams, we often analyze data in chunks using a moving window. This involves calculating statistics within a fixed-size window that slides over the data stream. This approach allows for dynamic and real-time outlier detection.
Coding Example: Z-Score in a Moving Window
Let’s implement the Z-Score method within a moving window to detect outliers in a continuous data stream.
Step 1: Import Libraries
python
import numpy as np

import pandas as pd

import matplotlib.pyplot as pltnp.random.seed(42)
Step 2: Generate Synthetic Data
python
# Generating synthetic data

data = np.random.normal(0, 1, 1000)

# Introduce some outliers

data[::50] = np.random.normal(10, 1, 20)
Step 3: Define Z-Score Function
python
def calculate_z_scores(window):

mean = np.mean(window)

std_dev = np.std(window)

return [(x - mean) / std_dev for x in window]
Step 4: Apply Moving Window
python
window_size = 50

z_scores = []window = data[i:i + window_size]
z_scores.append(calculate_z_scores(window))
Step 5: Identify Outliers
python
threshold = 3

outliers = np.where(np.abs(z_scores) > threshold)[0]outliers += window_size // 2
plt.plot(data, label=‘Data’)
plt.scatter(outliers, data[outliers], color=‘red’, label=‘Outliers’)
plt.legend()
plt.show()
Coding Example: Modified Z-Score in a Moving Window
Next, we implement the Modified Z-Score method using a moving window approach.
Step 1: Define Modified Z-Score Function
python
def calculate_modified_z_scores(window):

median = np.median(window)

mad = np.median([np.abs(x - median) for x in window])

return [0.6745 * (x - median) / mad for x in window]
Step 2: Apply Moving Window
python
modified_z_scores = []
for i in range(len(data) – window_size + 1):
window = data[i:i + window_size]
modified_z_scores.append(calculate_modified_z_scores(window))
modified_z_scores = np.array(modified_z_scores).flatten()
Step 3: Identify Outliers
python
threshold = 3.5

modified_outliers = np.where(np.abs(modified_z_scores) > threshold)[0]modified_outliers += window_size // 2
plt.plot(data, label=‘Data’)
plt.scatter(modified_outliers, data[modified_outliers], color=‘red’, label=‘Modified Z-Score Outliers’)
plt.legend()
plt.show()
Comparative Analysis
The Z-Score and Modified Z-Score methods each have their strengths and weaknesses. The Z-Score is straightforward and computationally efficient, but it can be sensitive to extreme values, which may skew the mean and standard deviation. The Modified Z-Score is more robust, especially in datasets with existing outliers, as it uses the median and MAD, which are less influenced by extreme values.
Performance Considerations
In continuous data streams, performance is critical. The choice between Z-Score and Modified Z-Score depends on the nature of the data and the presence of outliers. For clean data with minimal outliers, the Z-Score method is often sufficient. For datasets with frequent anomalies, the Modified Z-Score provides a more reliable measure.
Practical Applications
- Financial Data: In financial markets, outliers can indicate significant events like stock market crashes or sudden price spikes. Both methods can help in identifying these anomalies for further investigation.
- Network Security: Detecting unusual patterns in network traffic can help identify security breaches or attacks. A robust method like Modified Z-Score is preferred due to its resilience to noise.
- Environmental Monitoring: In sensor networks monitoring environmental data, outliers can signal faulty sensors or extreme environmental events. The moving window approach allows for real-time detection and response.
Conclusion
Outlier identification in continuous data streams is essential for accurate data analysis and decision-making. The Z-Score and Modified Z-Score methods provide effective means of detecting outliers, each with its advantages. The moving window technique enhances these methods by enabling real-time processing and dynamic analysis.
In practice, the choice of method should be guided by the characteristics of the data and the specific requirements of the application. Implementing these techniques in Python, as demonstrated, allows for flexible and efficient outlier detection tailored to various domains.
By understanding and applying these methods, data scientists and analysts can better manage and interpret continuous data streams, leading to more reliable and insightful conclusions.